
面积图渐变色如何配置,能否支持堆叠面积图配置不同渐变方向的渐变色?
问题描述
类似这样的面积图,
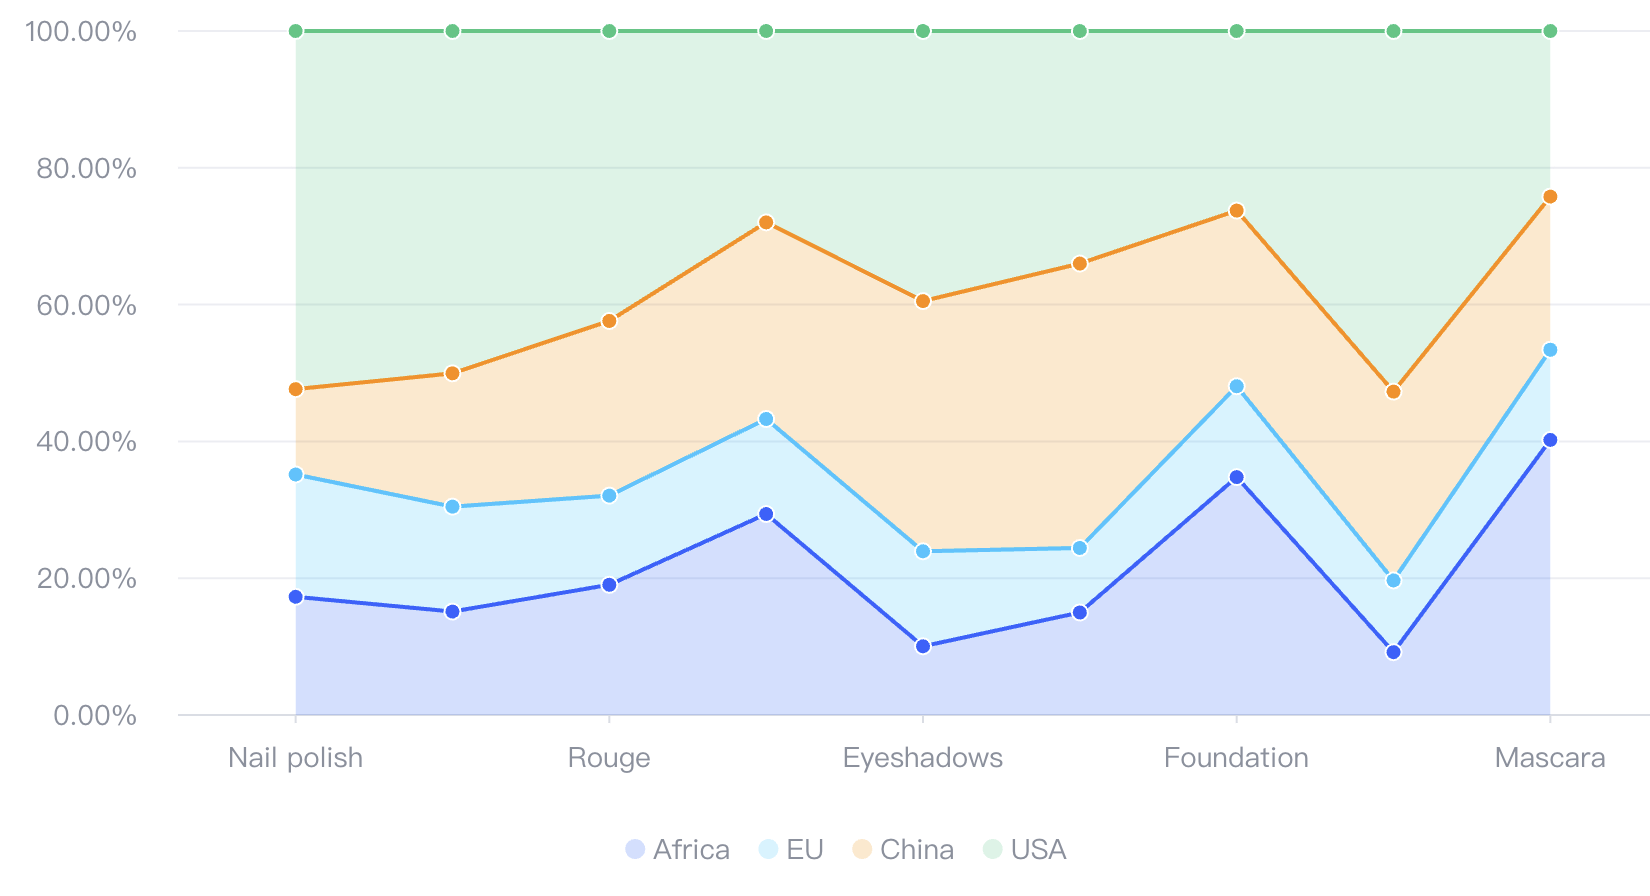
想要实现渐变色的效果,应该怎么实现?能够配置不同的渐变方向吗?
解决方案
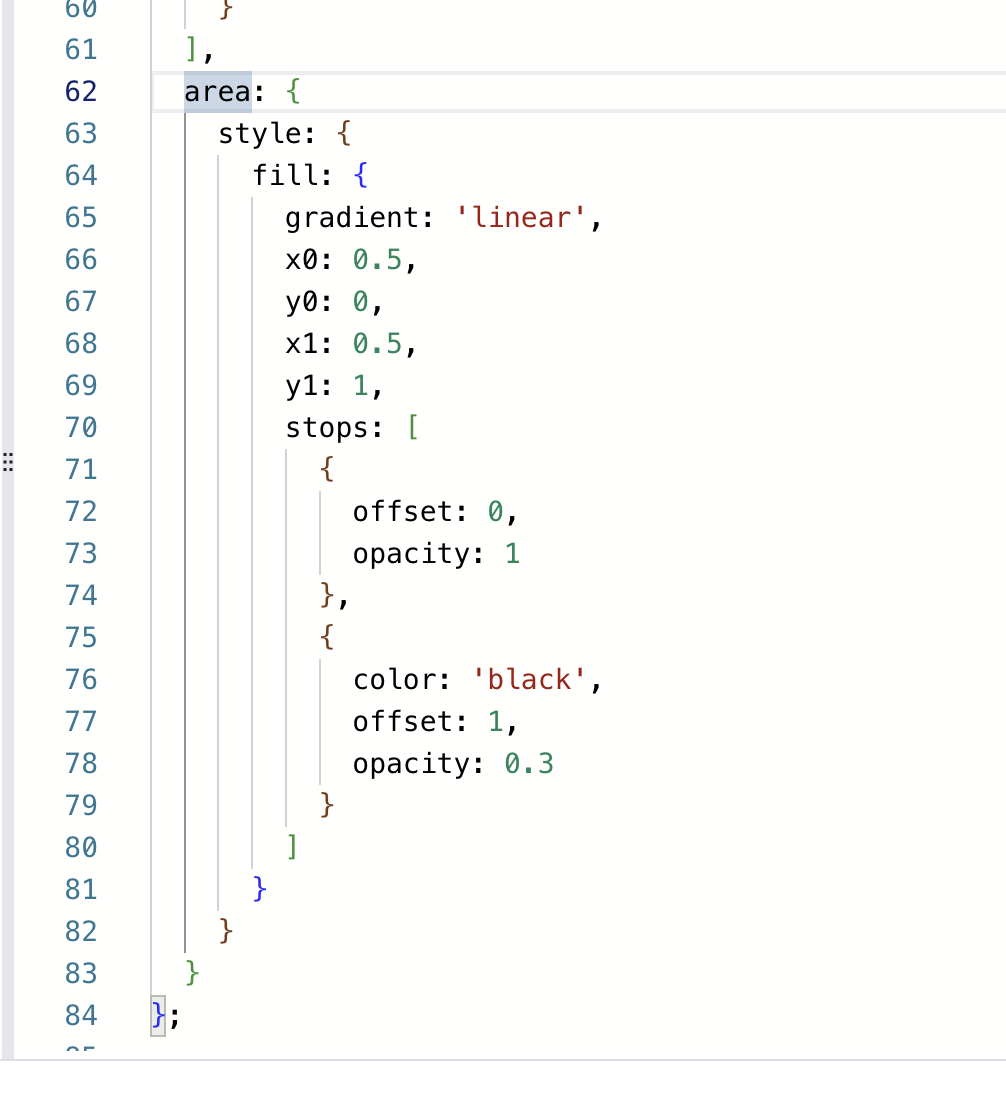
不同图表库的解决方案不一样,根据你给的 demo,在 VChart 中只需要配置 area.style.fill为渐变色,通过改变 x0 、 y0 、 x1 、 y1 这四个点的值来改变渐变的 方向。
代码示例
const spec = {
  type: 'area',
  data: {
    values: [
      { type: 'Nail polish', country: 'Africa', value: 4229 },
      { type: 'Nail polish', country: 'EU', value: 4376 },
      { type: 'Nail polish', country: 'China', value: 3054 },
      { type: 'Nail polish', country: 'USA', value: 12814 },
      { type: 'Eyebrow pencil', country: 'Africa', value: 3932 },
      { type: 'Eyebrow pencil', country: 'EU', value: 3987 },
      { type: 'Eyebrow pencil', country: 'China', value: 5067 },
      { type: 'Eyebrow pencil', country: 'USA', value: 13012 },
      { type: 'Rouge', country: 'Africa', value: 5221 },
      { type: 'Rouge', country: 'EU', value: 3574 },
      { type: 'Rouge', country: 'China', value: 7004 },
      { type: 'Rouge', country: 'USA', value: 11624 },
      { type: 'Lipstick', country: 'Africa', value: 9256 },
      { type: 'Lipstick', country: 'EU', value: 4376 },
      { type: 'Lipstick', country: 'China', value: 9054 },
      { type: 'Lipstick', country: 'USA', value: 8814 },
      { type: 'Eyeshadows', country: 'Africa', value: 3308 },
      { type: 'Eyeshadows', country: 'EU', value: 4572 },
      { type: 'Eyeshadows', country: 'China', value: 12043 },
      { type: 'Eyeshadows', country: 'USA', value: 12998 },
      { type: 'Eyeliner', country: 'Africa', value: 5432 },
      { type: 'Eyeliner', country: 'EU', value: 3417 },
      { type: 'Eyeliner', country: 'China', value: 15067 },
      { type: 'Eyeliner', country: 'USA', value: 12321 },
      { type: 'Foundation', country: 'Africa', value: 13701 },
      { type: 'Foundation', country: 'EU', value: 5231 },
      { type: 'Foundation', country: 'China', value: 10119 },
      { type: 'Foundation', country: 'USA', value: 10342 },
      { type: 'Lip gloss', country: 'Africa', value: 4008 },
      { type: 'Lip gloss', country: 'EU', value: 4572 },
      { type: 'Lip gloss', country: 'China', value: 12043 },
      { type: 'Lip gloss', country: 'USA', value: 22998 },
      { type: 'Mascara', country: 'Africa', value: 18712 },
      { type: 'Mascara', country: 'EU', value: 6134 },
      { type: 'Mascara', country: 'China', value: 10419 },
      { type: 'Mascara', country: 'USA', value: 11261 }
    ]
  },
  title: {
    visible: true,
    text: '100% stacked area chart of cosmetic products sales'
  },
  percent: true,
  xField: 'type',
  yField: 'value',
  seriesField: 'country',
  legends: [{ visible: true, position: 'middle', orient: 'bottom' }],
  axes: [
    {
      orient: 'left',
      label: {
        formatMethod(val) {
          return `${(val * 100).toFixed(2)}%`;
        }
      }
    }
  ],
  area: {
    style: {
      fill: {
        gradient: 'linear',
        x0: 0.5,
        y0: 0,
        x1: 0.5,
        y1: 1,
        stops: [
          {
            offset: 0,
            opacity: 1
          },
          {
            color: 'black',
            offset: 1,
            opacity: 0.3
          }
        ]
      }
    }
  }
};
结果展示
关于渐变色配置
从上方的 api 中,可以看到 VChart 中的渐变色与 canvas 的渐变色 api 一致,能较好的支持各种渐变需求。
可以从下图中了解渐变色的绘制规则。
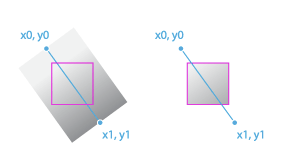
起点与终点
参数中有 2 组位置信息,上图中表明了起点与终点在渐变色绘制时的意义。
起点:(x0,y0)
终点:(x1,y1)
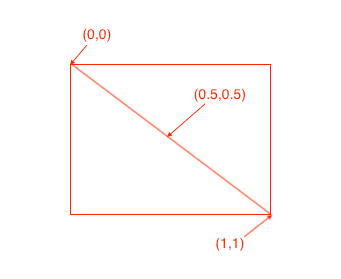
注意 在 VChart 中,起点,终点 的配置与 canvas 有少许不同。canvas 中位置是画布中的点位置。在 chartSpace 中,位置是图元 左上角 至图元 右下角 【0,1】 区间的比例位置。具体了请看下图:
渐变阶段
这一部分与 canvas 的 api 没有区别,每一个阶段都需要配置 offset 与 color。可以配置多个阶段。